Performance
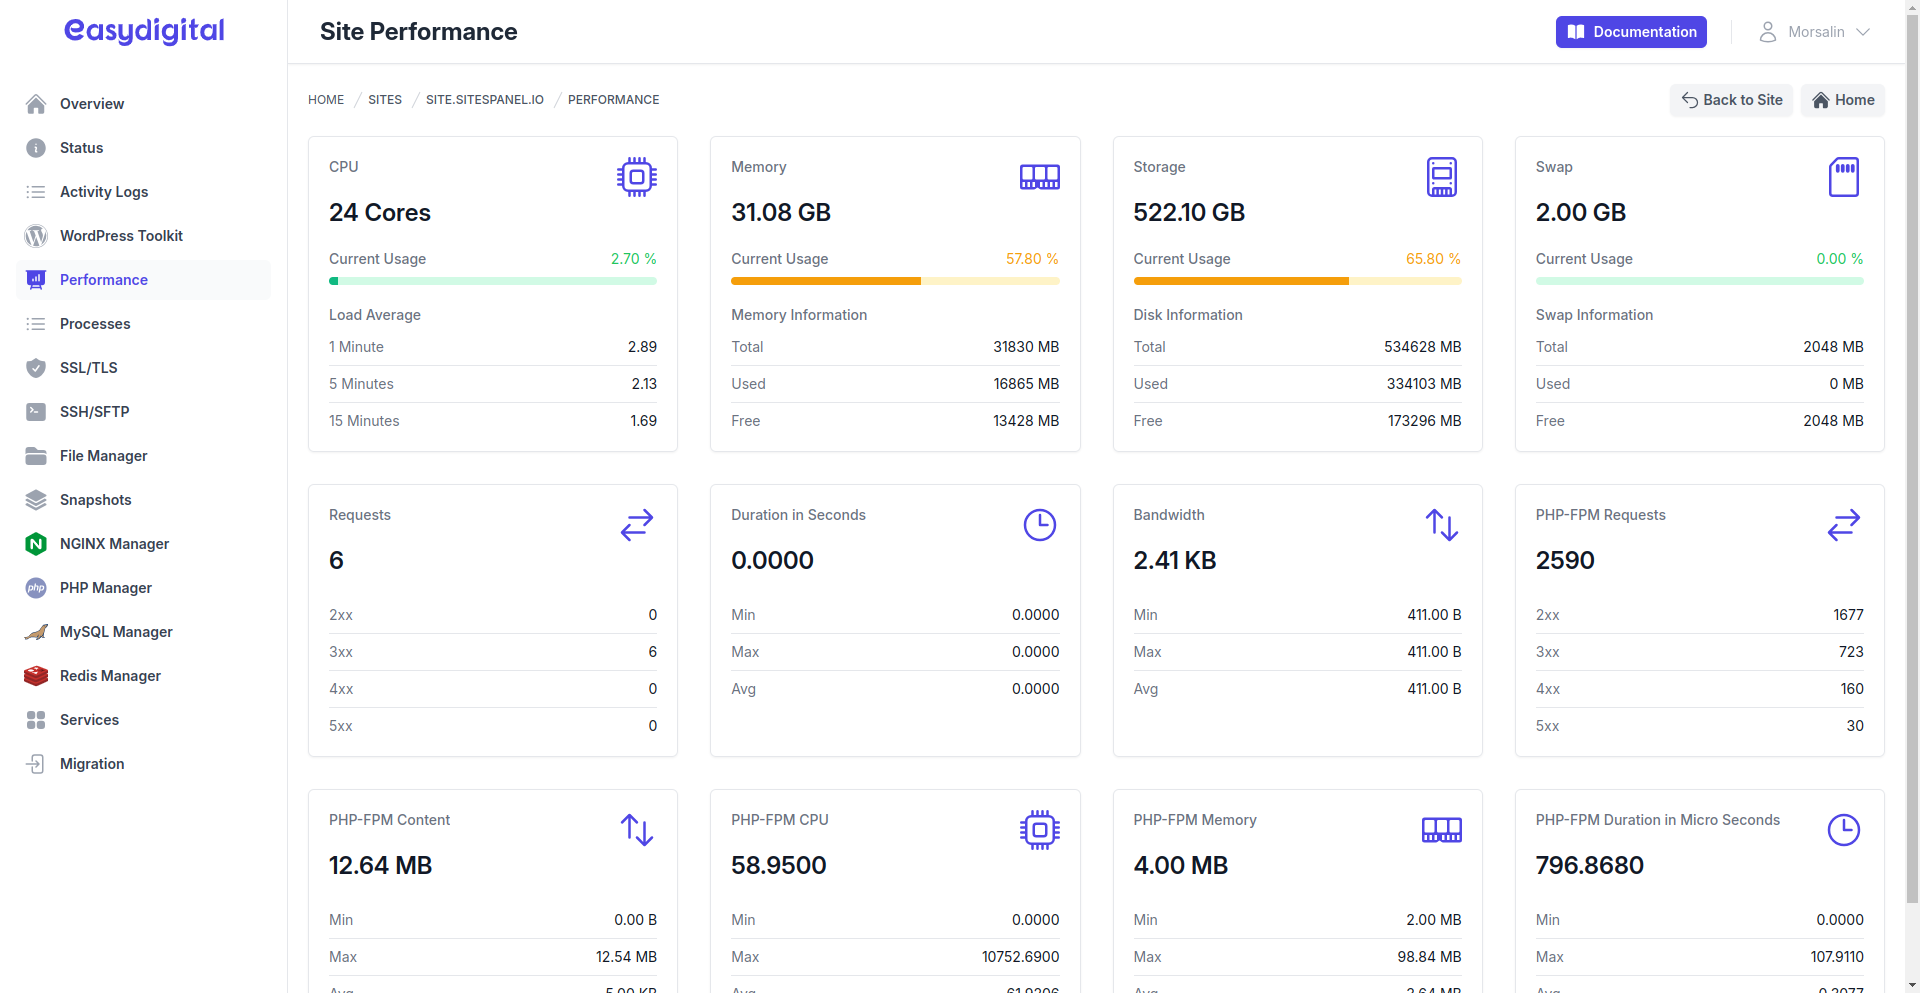
The Site Performance page provides detailed insights into your system's performance and its impact on your site. Below are the metrics available for monitoring and troubleshooting.
 |
|---|
System Information
This section provides key details about your machine's hardware and memory usage.
CPU
Number of Cores: Displays the total number of CPU cores on your server.
Usage in %: Shows the percentage of CPU usage.
Load Average: Provides the system load over three time periods:
1 Minute: Load average for the last minute.
5 Minutes: Load average for the last 5 minutes.
15 Minutes: Load average for the last 15 minutes.
Memory
Total Memory: The total physical memory installed on your system.
Usage in %: Percentage of memory currently in use.
Memory Info:
Total: Total memory available.
Used: Memory currently in use.
Free: Memory that is available.
Storage
Total Size: The total disk space available on the server.
Usage in %: The percentage of storage space in use.
Disk Info:
Total: Total disk space.
Used: Amount of disk space used.
Free: Available disk space.
Swap
Total Size: The total amount of swap space available.
Usage in %: Percentage of swap space used.
Disk Info:
Total: Total swap space.
Used: Used swap space.
Free: Free swap space.
Nginx Daily Insights
These insights show the performance of the Nginx web server on your site.
NGINX Requests
2xx: The number of successful HTTP requests (e.g., 200 OK).
3xx: The number of redirected requests (e.g., 301 Moved Permanently).
4xx: The number of client errors (e.g., 404 Not Found).
5xx: The number of server errors (e.g., 500 Internal Server Error).
NGINX Duration in Seconds
Total Sum: Total time spent handling all requests (in seconds).
Min: Minimum time taken for a request to complete (in seconds).
Max: Maximum time taken for a request to complete (in seconds).
Avg: Average time taken for a request to complete (in seconds).
NGINX Bandwidth
Total Sum: Total data transferred in and out (in bytes).
Min: Minimum bandwidth usage per request (in bytes).
Max: Maximum bandwidth usage per request (in bytes).
Avg: Average bandwidth usage per request (in bytes).
PHP-FPM Daily Insights
These insights display the performance of PHP-FPM (FastCGI Process Manager) for handling PHP requests.
Requests
2xx: The number of successful PHP requests.
3xx: The number of redirected PHP requests.
4xx: The number of client error PHP requests.
5xx: The number of server error PHP requests.
Request Body
Total Sum: Total size of all request bodies (in bytes).
Min: Minimum request body size (in bytes).
Max: Maximum request body size (in bytes).
Avg: Average request body size (in bytes).
PHP-FPM CPU
Last Request: CPU usage for the most recent PHP request (in percentage).
Min: Minimum CPU usage for PHP requests.
Max: Maximum CPU usage for PHP requests.
Avg: Average CPU usage for PHP requests.
PHP-FPM Memory
Last Request: Memory usage for the most recent PHP request (in MB).
Min: Minimum memory usage for PHP requests.
Max: Maximum memory usage for PHP requests.
Avg: Average memory usage for PHP requests.
Duration in Seconds
Last Request: Duration of the most recent PHP request (in seconds).
Min: Minimum duration of PHP requests.
Max: Maximum duration of PHP requests.
Avg: Average duration of PHP requests.