Processes
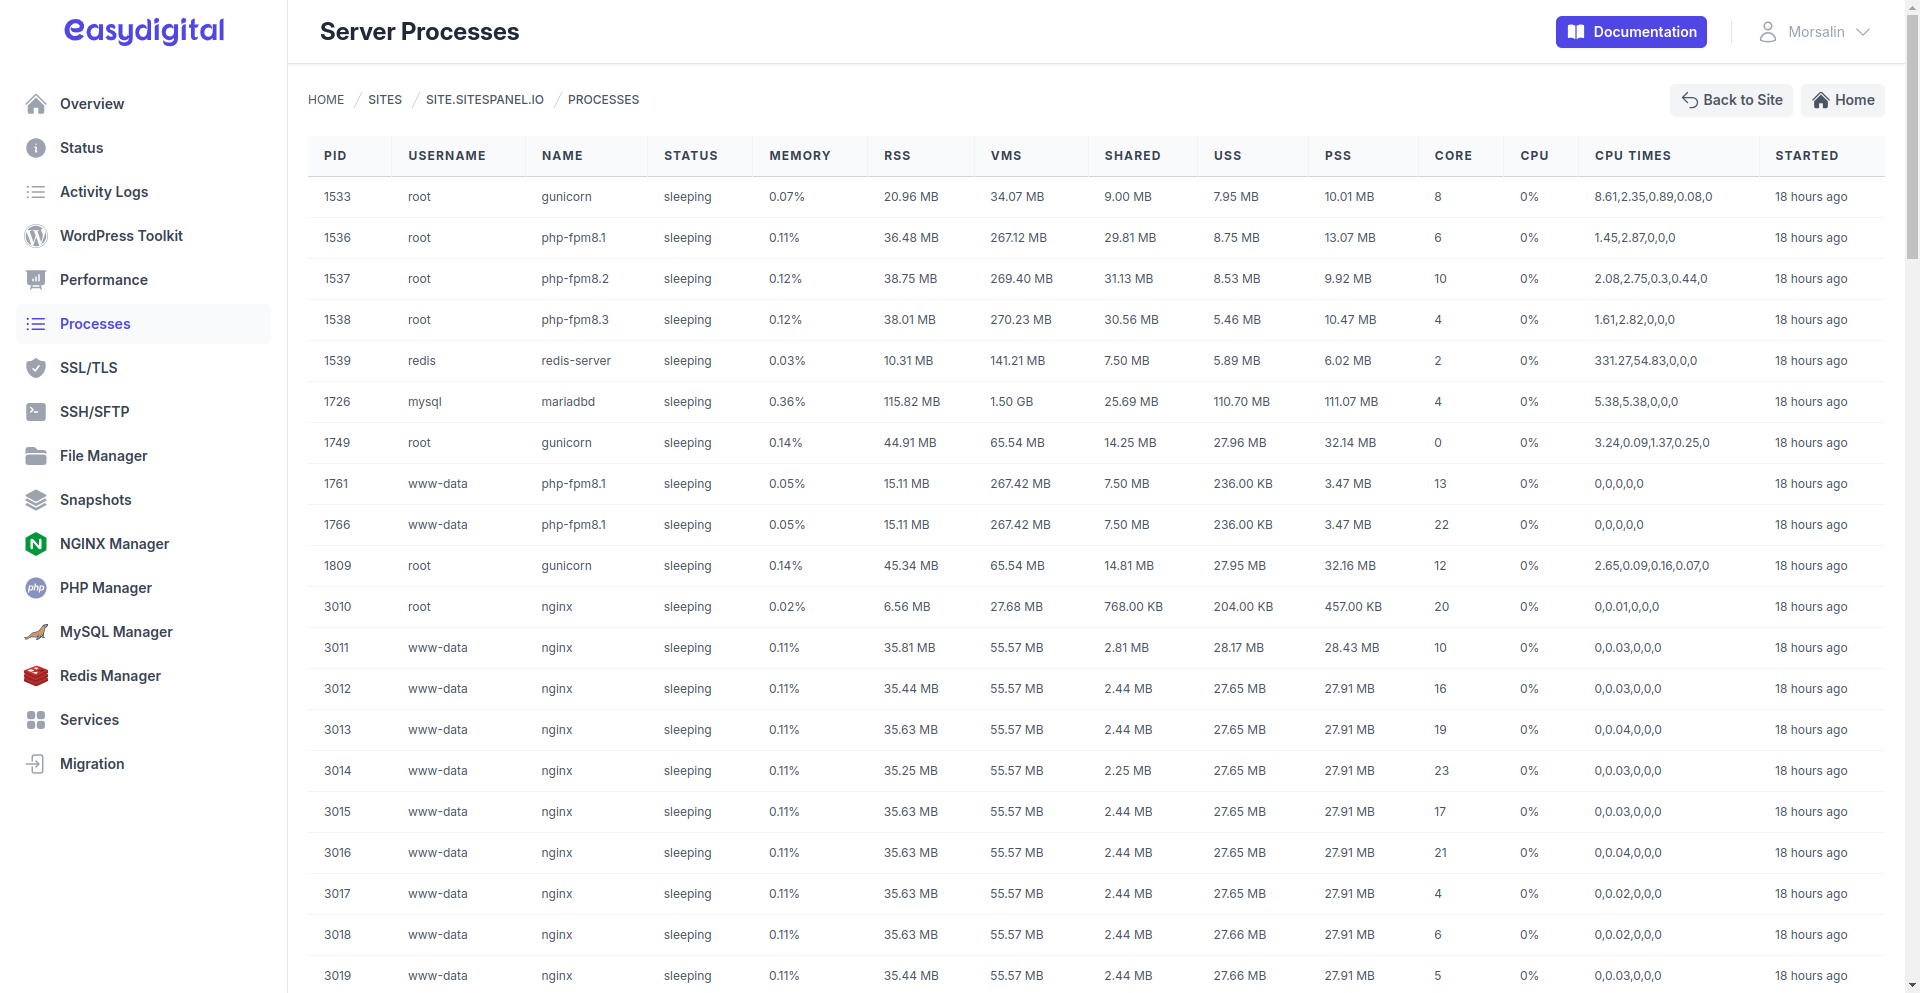
The Processes page provides detailed information about the system processes running to support your sites. The process table displays various details about each active process on your machine. This page is a valuable tool for understanding how your system resources are being used, identifying resource-intensive processes, and optimizing your server's performance accordingly.
 |
|---|
Process Information Table
This table provides detailed information about processes running on the system. The data is derived from psutil and helps monitor and manage system performance.
Attribute | Description |
|---|---|
PID | Process ID: A unique numerical identifier assigned by the operating system to each running process. Useful for tracking or managing specific processes. |
USER | User/Owner: The account or user who initiated or owns the process. Helps identify if a process belongs to a specific user or system service. |
NAME | Process Name: The name of the executable or application associated with the process, e.g., "nginx", "mariadbd", "php-fpm-" or "redis-server". |
STATUS | Process Status: Indicates the current state of the process, such as: running, sleeping, stopped, or zombie. |
MEMORY (%) | Memory Usage Percentage: The percentage of total physical memory (RAM) consumed by the process. Useful for identifying memory-intensive processes. |
RSS | Resident Set Size: The actual memory occupied by the process in RAM, excluding swapped-out memory. Helps understand active memory usage. |
VMS | Virtual Memory Size: The total virtual memory allocated to the process, including memory that might not be fully utilized (e.g., reserved but unused memory). |
SHARED | Shared Memory: The portion of memory shared with other processes, such as shared libraries. |
USS | Unique Set Size: Memory exclusively allocated to the process and not shared with others. Useful for a precise footprint of the process. |
PSS | Proportional Set Size: Memory usage that accounts for shared memory, dividing it proportionally among processes sharing it. |
CORE NUMBER | CPU Core Number: Indicates the specific CPU core or cores that the process is utilizing. Useful for analyzing workload distribution on multi-core systems. |
CPU (%) | CPU Usage Percentage: The percentage of CPU resources used by the process. High values may indicate a resource-intensive process. |
CPU TIMES | CPU Times: Breakdown of CPU usage: User Time (time spent executing process code) and System Time (time spent in kernel mode). |
STARTED AT | Process Start Time: The exact timestamp when the process was initiated. Useful for monitoring long-running processes or identifying recently started ones. |
Key Memory Metrics:
RSS (Resident Set Size): Shows the physical memory currently used.
VMS (Virtual Memory Size): Indicates the total memory allocated, including reserved and swapped memory.
USS (Unique Set Size): Identifies memory unique to the process.
PSS (Proportional Set Size): Fairly allocates shared memory usage among all processes sharing it.
Practical Uses:
Performance Monitoring: Attributes like
MEMORY (%),CPU (%), andRSShelp identify resource bottlenecks.Troubleshooting: Fields like
STATUS,CORE NUMBER, andSTARTED ATassist in diagnosing issues with specific processes.System Optimization: Analyze memory and CPU usage patterns to improve system performance and efficiency.
PHP-FPM Optimization: To optimize PHP-FPM workers, analyze key process metrics like memory usage (RSS, VMS, USS, PSS), CPU utilization (CPU %), and the number of active processes. First, calculate the average memory usage per worker using the RSS value and adjust pm.max_children accordingly to match available server memory. Set pm.start_servers, pm.min_spare_servers, and pm.max_spare_servers based on traffic patterns to manage idle workers effectively. Monitoring CPU usage helps identify overloading of specific cores, allowing for better distribution of a load. Additionally, configure pm.max_requests to prevent memory leaks by recycling workers after a set number of requests. Regularly monitor these metrics and adjust settings based on real-time traffic to maintain optimal PHP-FPM performance.