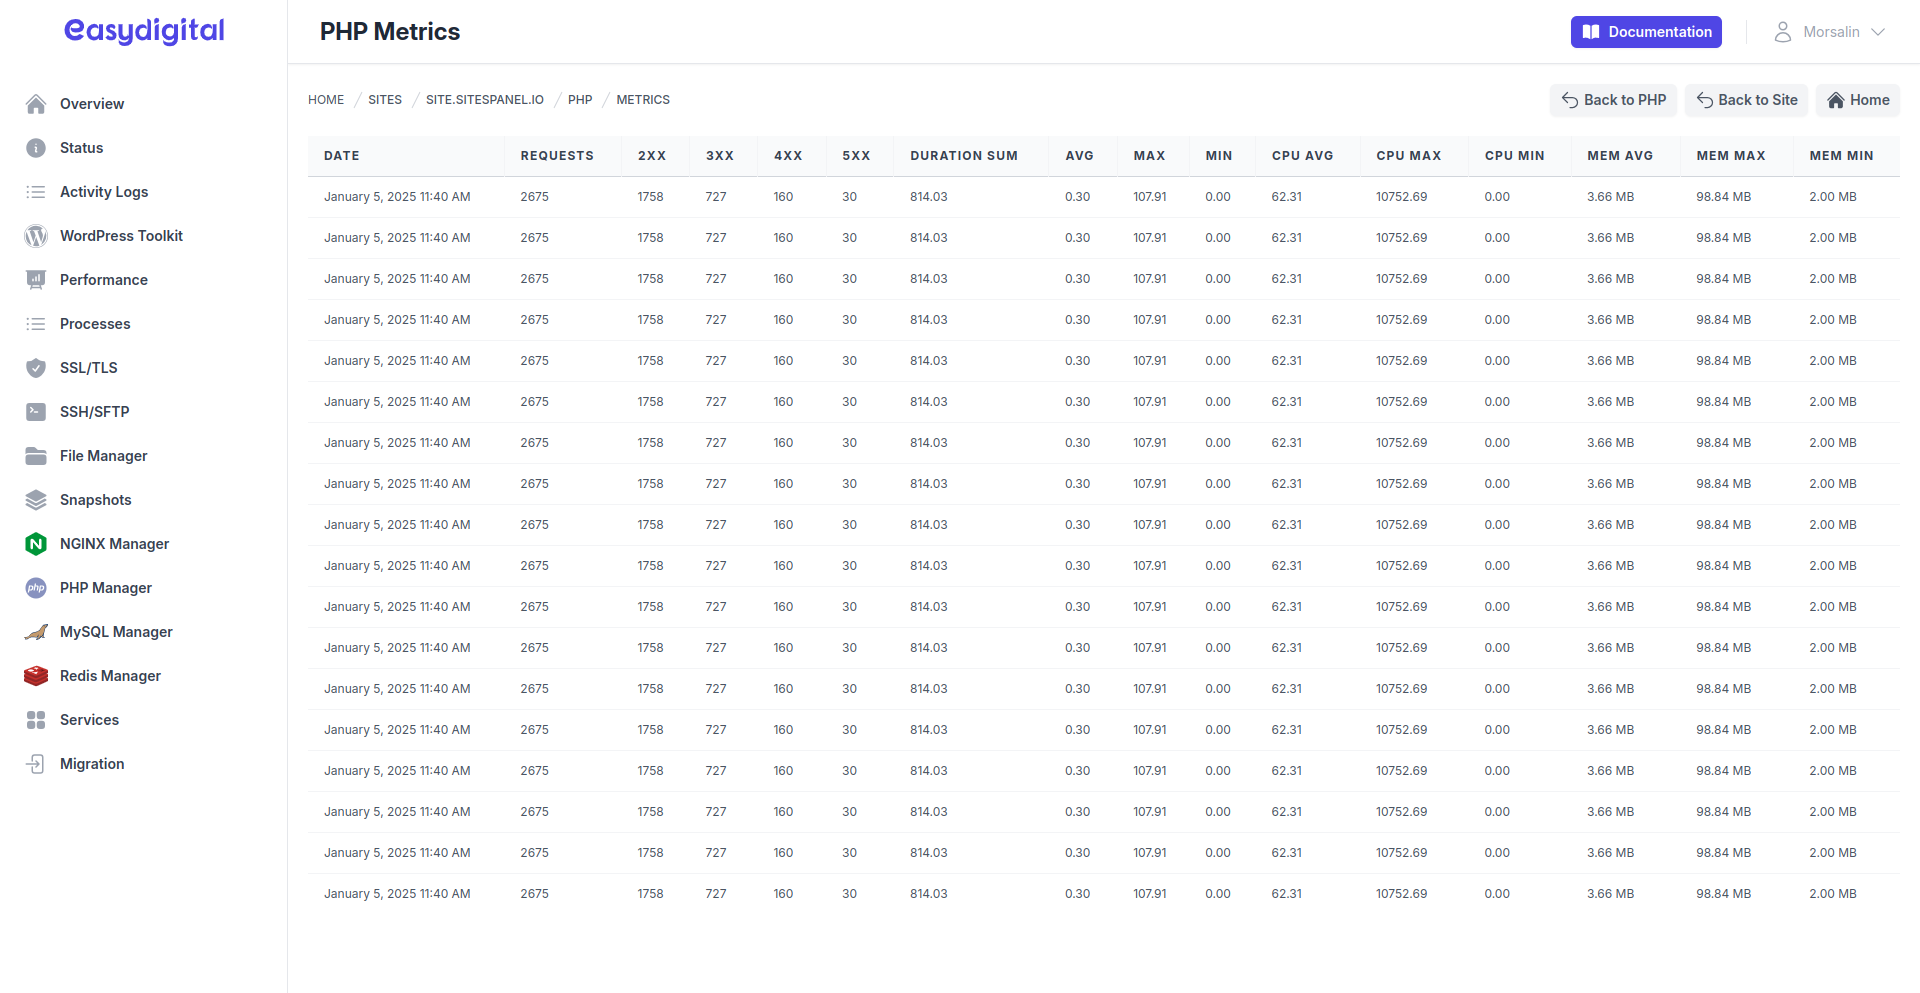
Metrics
The metrics are collected from PHP-FPM access logs, providing insights into request processing, resource usage, and response statuses. However, these metrics may not always be completely accurate due to potential logging inconsistencies or missing data. Metrics are gathered hourly, offering several benefits: they allow for near real-time monitoring of application performance, help identify patterns or anomalies in traffic, and enable proactive troubleshooting of performance issues. Hourly collection ensures that any spikes or dips in resource utilization and request handling are quickly detected, empowering administrators to maintain optimal server performance and user experience.
 |
|---|
Metric Properties
Column | Description |
|---|---|
Date | The date the metrics were recorded. |
Requests | Total number of requests processed by PHP. |
2XX | Total requests served with status codes 200–299. |
3XX | Total requests served with status codes 300–399. |
4XX | Total requests served with status codes 400–499. |
5XX | Total requests served with status codes 500–599. |
Duration Sum | Total duration of all requests. |
Duration Avg | Average duration of all requests. |
Duration Max | Maximum duration of any single request. |
Duration Min | Minimum duration of any single request. |
CPU Avg | Average CPU usage across all requests. |
CPU Max | Maximum CPU usage of any single request. |
CPU Min | Minimum CPU usage of any single request. |
Memory Avg | Average memory usage across all requests. |
Memory Max | Maximum memory usage of any single request. |
Memory Min | Minimum memory usage of any single request. |