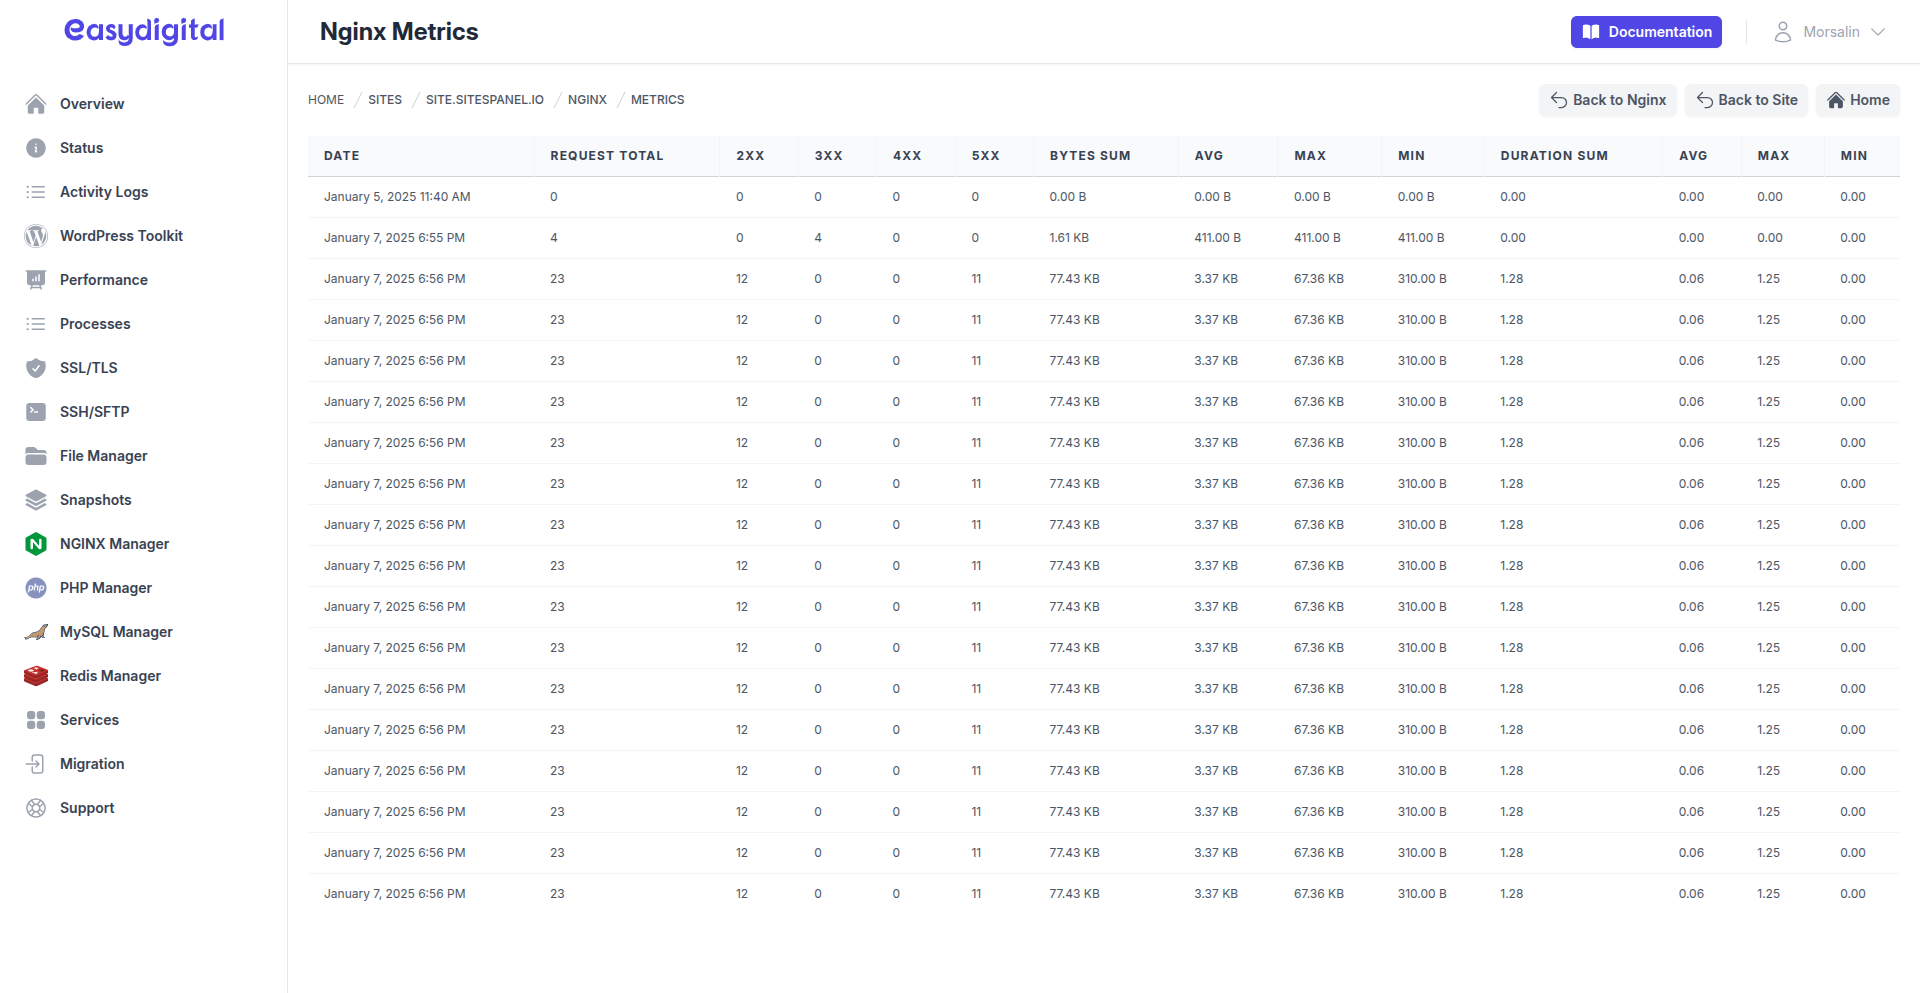
Metrics
Metrics are gathered from NGINX access logs, offering valuable insights into request processing, resource utilization, and response statuses. While these logs provide a wealth of information, the metrics derived from them may occasionally lack full accuracy due to potential logging inconsistencies or missing entries. Metrics are collected hourly, providing significant benefits: they enable near real-time monitoring of server performance, assist in identifying traffic patterns or anomalies, and support proactive troubleshooting of potential issues. This regular collection ensures that sudden spikes or dips in traffic and resource usage are detected promptly, empowering administrators to optimize server operations and enhance user experience.
 |
|---|
Metric Properties
Column | Description |
|---|---|
Date | The date the metrics were recorded. |
Requests | Total number of requests processed by Nginx. |
2XX | Total requests served with status codes 200–299. |
3XX | Total requests served with status codes 300–399. |
4XX | Total requests served with status codes 400–499. |
5XX | Total requests served with status codes 500–599. |
Bytes Sum | Total bytes of all requests. |
Bytes Avg | Average bytes of all requests. |
Bytes Max | Maximum bytes of any single request. |
Bytes Min | Minimum bytes of any single request. |
Duration Sum | Total duration of all requests. |
Duration Avg | Average duration of all requests. |
Duration Max | Maximum duration of any single request. |
Duration Min | Minimum duration of any single request. |